Circuit Visualization
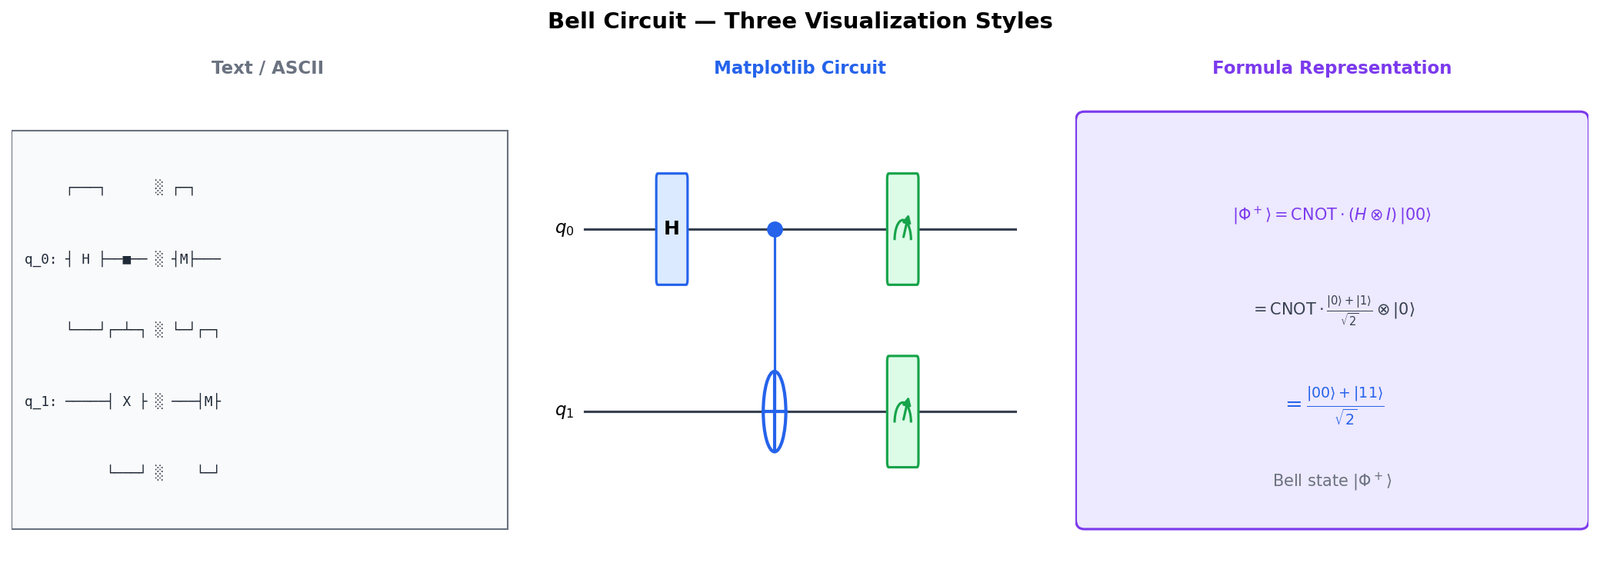
qc.draw() renders circuits as ASCII, matplotlib diagrams, or LaTeX, helping verify gate layout before execution
Source: mortalapps.com- The
qc.draw()method is Qiskit's primary tool for visualizing quantum circuits. - The 'text' backend generates lightweight ASCII-art diagrams directly in the terminal without external dependencies.
- The 'mpl' backend renders high-quality graphical diagrams using Matplotlib, requiring
matplotlibandpylatexenc. - The 'latex' backend generates publication-quality vector graphics, requiring a local LaTeX installation.
- Visualizing circuits is a critical debugging practice for verifying gate alignment, register mapping, and circuit depth.
- You can customize the visual style of Matplotlib drawings using built-in themes (like 'iqp') or custom style dictionaries.
Why This Matters
As quantum circuits grow in size and complexity, verifying their structure programmatically becomes increasingly difficult. Reading raw lines of code does not easily reveal the parallel execution of gates, the alignment of barriers, or the routing of multi-qubit operations. To bridge this gap, Qiskit provides a suite of powerful circuit visualization tools that render your programmatic circuits into highly readable graphical diagrams.
Visualizing a circuit is not just about aesthetics; it is a critical debugging practice. By rendering a circuit, you can instantly spot structural errors, such as applying a gate to the wrong qubit, misaligning measurement registers, or introducing unnecessary gate depth. Qiskit supports multiple rendering backends, ranging from lightweight text-based ASCII art that prints directly in your terminal, to publication-quality vector graphics rendered using Matplotlib or LaTeX.
In this topic, you will master Qiskit's visualization engine. You will learn how to use the qc.draw() method with different output backends, customize the visual style of your diagrams, and use visualization to analyze circuit depth and gate alignment. This skill will allow you to document your work professionally and debug complex designs with ease.
Core Intuition
Think of Qiskit's circuit drawing tools like the different viewing modes in a modern CAD (Computer-Aided Design) software used by architects. When you are quickly drafting a design, you might use a wireframe mode (text-based ASCII drawing) because it loads instantly and fits right inside your terminal. It's not pretty, but it shows you the basic layout of the walls and doors.
When you are presenting your design to a client, you switch to a high-resolution 3D render (Matplotlib mode). This mode adds color, clear icons, and professional styling, making it easy for anyone to understand the layout. Finally, when you are publishing your blueprints in a technical manual, you use a vector-based blueprint mode (LaTeX mode) which ensures that every line and symbol is perfectly sharp and mathematically precise, no matter how much you zoom in.
In Qiskit, the qc.draw() method is your camera. By changing its parameters, you can switch between these different lenses, customizing the style, colors, and level of detail to match your current task, whether that is quick terminal debugging, notebook prototyping, or academic publishing.
Visualization
Technical Explanation
The QuantumCircuit.draw() method is the primary interface for circuit visualization in Qiskit. It supports several rendering backends, specified by the output parameter: 1. text: The default backend. It generates an ASCII-art text representation of the circuit. It requires no external dependencies and prints directly to the standard output. 2. mpl: Renders the circuit as a high-quality graphical image using Matplotlib. It requires the matplotlib and pylatexenc Python packages. It supports extensive styling customization via a style dictionary. 3. latex: Generates a publication-quality vector graphic using the LaTeX qcircuit package. It requires a local LaTeX installation.
Here is a complete, runnable program that demonstrates how to generate and customize these different visualizations:
from qiskit import QuantumCircuit

# Build a representative circuit with various elements
qc = QuantumCircuit(3, 2)
qc.h(0)
qc.cx(0, 1)
qc.ry(0.5, 2) # Parameterized rotation on qubit 2
qc.barrier()
qc.ccx(0, 1, 2) # Toffoli (CCNOT) gate
qc.measure([0, 1], [0, 1])

# 1. Text-based drawing (prints directly to console)
print("--- Text Drawing ---")
print(qc.draw(output='text'))

# 2. Matplotlib-based drawing (returns a Figure object)
# Note: In a Jupyter notebook, simply calling qc.draw('mpl') displays the image.
try:
    fig = qc.draw(output='mpl', style='iqp') # 'iqp' is a professional dark-themed style
    fig.savefig("circuit_mpl.png", bbox_inches='tight')
    print("\nMatplotlib drawing saved as 'circuit_mpl.png'")
except Exception as e:
    print("\nMatplotlib drawing failed. Ensure matplotlib is installed.")

# 3. LaTeX-based drawing (returns a Figure object if latex is installed)
try:
    latex_fig = qc.draw(output='latex')
    latex_fig.savefig("circuit_latex.pdf")
    print("LaTeX drawing saved as 'circuit_latex.pdf'")
except Exception as e:
    print("LaTeX drawing skipped (requires local LaTeX installation).")
In this code, we apply a variety of gates to demonstrate how different renderers handle complex elements like multi-controlled gates (ccx) and parameterized rotations (ry). The style parameter in the Matplotlib drawer allows you to apply pre-configured themes (like 'iqp' or 'clifford') or pass a custom dictionary to change colors, fonts, and gate shapes.
Key Takeaways
qc.draw() method is Qiskit's primary tool for visualizing quantum circuits.matplotlib and pylatexenc.